Intraday
Intraday allocation of cross-border capacities takes the form of an explicit allocation using the First Come, First Served principle. CEPS fulfills the function of capacity allocator on an intraday basis www.ceps.cz.
Intraday allocation of cross-border capacities takes place on cross-border profiles SK/CZ, SK/HU and SK/PL from 1.12. 2010.
Intraday capacity allocation on the SK/CZ profile is performed in the 1-hour session model from the trading day 3.4.2012.
Intraday capacity allocation on the SK/HU profile is performed in the 1-hour session model from the trading day 5.9.2018.
Intraday capacity allocation on the SK/PL profile is performed in the 4-hour session model.
Intraday capacity allocation is not performed on the SK/UA profile.
The procedure and rules for intra-day capacity allocation and cross-border nomination are described in the attached INTRADAY CAPACITY ALLOCATION AND NOMINATION PROCEDURE Trader Guide
SEPS Auction Office provides support for the nomination and matching processes for intra-day cross-border transmission:
e-mail: aukcie@sepsas.sk
tel.: +421 2 5069 2804
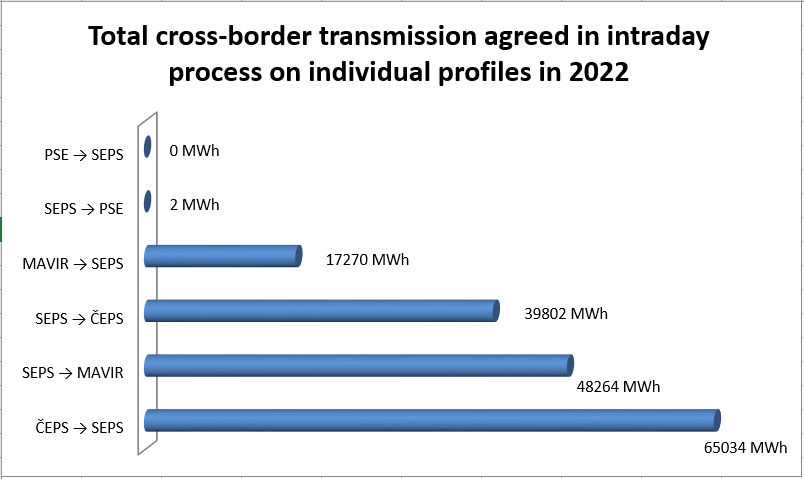
Percentage of cross-border transmissions agreed in Intraday process to total cross-border transmission – January – February 2022
| Profile | Cross-border transmission Intraday (MWh) |
Total cross-border transmission (MWh) |
Percentage |
| SEPS › ČEPS | 39 802,0 | 43 842,5 | 90,78% |
| ČEPS › SEPS | 65 034,0 | 2 003 848,0 | 3,25% |
| SEPS › MAVIR | 48 264,0 | 2 896 633,6 | 1,67% |
| MAVIR › SEPS | 17 270,0 | 19 747,8 | 87,45% |
| SEPS › PSE | 2,0 | 5 929,6 | 0,03% |
| PSE › SEPS | 0,0 | 849 767,7 | 0,00% |
Graphs of total monthly cross-border transmissions agreed via Intraday in individual hours of a day are published here.
ANNOUNCEMENT
On November 29, 2022, the SIDC project brought about a change in the intraday allocation of cross-border transmission capacities, and ČEPS as the entity operating the regional allocation platform was replaced by the pan-European centralized XBID solution. The platform for submission of offers by market participants registered in Slovakia is the ISOT system (IDM module) OKTE. The implementation of the XBID project also brought the possibility of trading 60- and 15-minute products through a solution based on implicit continuous matching.
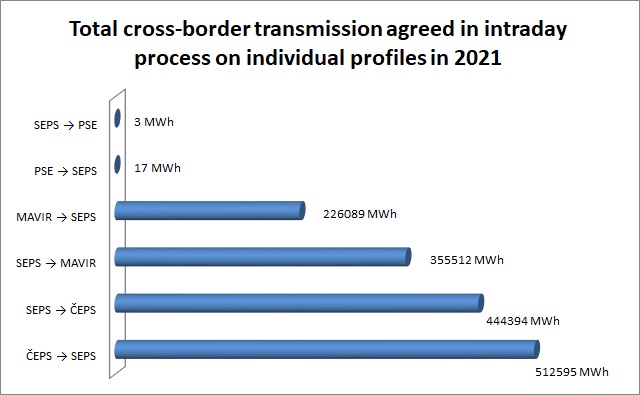
Percentage of cross-border transmissions agreed in Intraday process to total cross-border transmission – January – December 2021
| Profile | Cross-border transmission Intraday (MWh) |
Total cross-border transmission (MWh) |
Percentage |
| SEPS › ČEPS | 444 394,0 | 979 052,5 | 45,39% |
| ČEPS › SEPS | 512 595,0 | 9 906 435,1 | 5,17% |
| SEPS › MAVIR | 355 512,0 | 11 488 849,3 | 3,09% |
| MAVIR › SEPS | 226 089,0 | 560 992,2 | 40,30% |
| SEPS › PSE | 3,0 | 132 081,1 | 0,00% |
| PSE › SEPS | 17,0 | 2 821 386,1 | 0,00% |
Graphs of total monthly cross-border transmissions agreed via Intraday in individual hours of a day are published here.
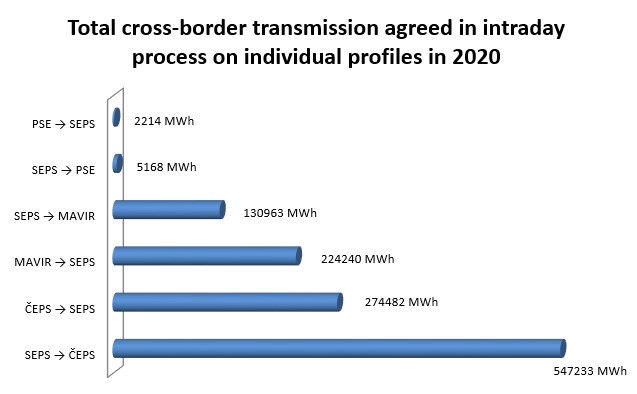
Percentage of cross-border transmissions agreed in Intraday process to total cross-border transmission – January – December 2020
| Profile | Cross-border transmission Intraday (MWh) |
Total cross-border transmission (MWh) |
Percentage |
| SEPS › ČEPS | 547 233,0 | 888 122,7 | 61,62% |
| ČEPS › SEPS | 274 482,0 | 11 763 734,2 | 2,33% |
| SEPS › MAVIR | 130 963,0 | 9 177 399,3 | 1,43% |
| MAVIR › SEPS | 224 240,0 | 356 285,5 | 62,94% |
| SEPS › PSE | 5 168,0 | 416 133,0 | 1,24% |
| PSE › SEPS | 2 214,0 | 185 488,0 | 1,19% |

Graphs of total monthly cross-border transmissions agreed via Intraday in individual hours of a day are published here.
ANNOUNCEMENT
PSE and SEPS common statement on Intra-Day Market allocation on the Polish-Slovak border
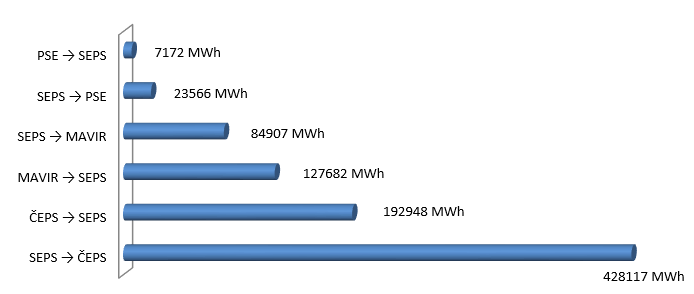
Percentage of cross-border transmissions agreed in Intraday process to total cross-border transmission – January – December 2019
| Profile | Cross-border transmission Intraday (MWh) |
Total cross-border transmission (MWh) |
Percentage |
| SEPS – ČEPS | 170 737,0 | 271 179,6 | 62,96% |
| SEPS – ČEPS | 428 117,0 | 727 001,8 | 58,89% |
| ČEPS – SEPS | 192 948,0 | 12 366 713,5 | 1,56% |
| SEPS – MAVIR | 84 907,0 | 8 887 952,1 | 0,96% |
| MAVIR – SEPS | 127 682,0 | 281 001,2 | 45,44% |
| SEPS – PSE | 23 566,0 | 194 048,0 | 12,14% |
| PSE – SEPS | 7 172,0 | 206 282,0 | 3,48% |
Total cross-border transmission agreed in Intraday process
on individual profiles – January – December 2019
Graphs of total monthly cross-border transmissions agreed via Intraday in individual hours of a day are published here.
ANNOUNCEMENT
Announcement on Intra-Day capacity allocation on the Slovak-Polish border
Polskie Sieci Elektroenergetyczne S.A. (PSE) and Slovenská elektrizacná prenosová sústava, a. s. (SEPS) acting as Transmission System Operators (TSOs) respectively in Poland and in Slovakia inform that the Intra-Day capacity allocation on Polish-Slovak border will be temporarily suspended as of 19./20.11.2019 (the last delivery day for which the intra-day allocation of capacities on the SK / PL profile will take place is the delivery day 19.11.2019). The suspension results from the implementation of the Single Intra-Day Coupling (SIDC) via XBID 2nd wave go-live in Poland which does not cover the Polish-Slovak bidding zone border. After successful launch of XBID 2nd wave, implementation of an interim solution based on the explicit allocation mechanism (Interim Solution) is planned for the Polish-Slovak border. The gap between the launch of XBID 2nd wave and the Interim Solution results from the need to implement the explicit allocation mechanism integrated with SIDC on the PSE side and is expected to last for about 2 months. Implementation of the Interim Solution in the second half of January 2020 is possible due to effective cooperation of both TSOs.
Information on the go-live date of Interim Solution on Polish-Slovak border shall be provided by the TSOs well in advance.
The expected target solution is to include the Polish-Slovak border in the SIDC.
SEPS as the transmission system operator in the territory of Slovakia due to the announced temporary interruption of the intraday allocation of transmission capacities at the SK-PL border informs that the explicit intraday allocation of cross-border transmission capacities at the SK-CZ and SK-HU borders will continue as before.
Percentage of cross-border transmissions agreed in Intraday process to total cross-border transmission – January – December 2018
| Profile | Cross-border transmission Intraday (MWh) |
Total cross-border transmission (MWh) |
Percentage |
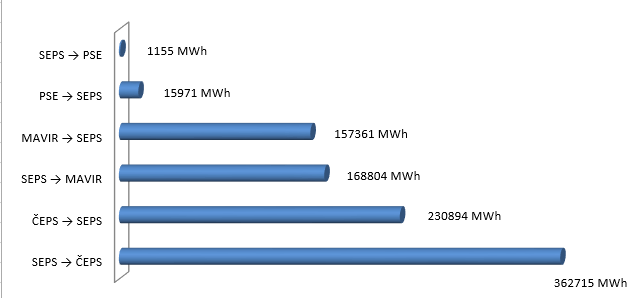
| SEPS – ČEPS | 362 715,0 | 2 506 371,6 | 14,47% |
| ČEPS – SEPS | 230 894,0 | 12 890 245,8 | 1,79% |
| SEPS – MAVIR | 168 804,0 | 7 753 845,2 | 2,18% |
| MAVIR – SEPS | 157 361,0 | 715 473,3 | 21,99% |
| SEPS – PSE | 1 155,0 | 44 612,0 | 2,59% |
| PSE – SEPS | 15 971,0 | 407 022,0 | 3,92% |
Total cross-border transmission agreed in Intraday process in 2018
on individual profiles – January – December 2018
Graphs of total monthly cross-border transmissions agreed via Intraday in individual hours of a day are published here.
Percentage of cross-border transmissions agreed in Intraday process to total cross-border transmission – January – December 2017
| Profile | Cross-border transmission Intraday (MWh) |
Total cross-border transmission (MWh) |
Percentage |
| SEPS – ČEPS | 317 204,0 | 1 573 815,1 | 20,16% |
| ČEPS – SEPS | 209 254,0 | 13 787 572,2 | 1,52% |
| SEPS – MAVIR | 91 233,0 | 9 022 644,0 | 1,01% |
| MAVIR – SEPS | 85 173,0 | 269 101,9 | 31,65% |
| SEPS – PSE | 670,0 | 9 164,0 | 7,31% |
| PSE – SEPS | 47 551,0 | 831 309,0 | 5,72% |
Total cross-border transmission agreed in Intraday process in 2017
on individual profiles – January – December 2017
Graphs of total monthly cross-border transmissions agreed via Intraday in individual hours of a day are published here.
Percentage of cross-border transmissions agreed in Intraday process to total cross-border transmission – January – December 2016
| Profile | Cross-border transmission Intraday (MWh) |
Total cross-border transmission (MWh) |
Percentage |
| SEPS – ČEPS | 275 908,0 | 3 154 293,6 | 8,75 % |
| ČEPS – SEPS | 222 699,0 | 12 525 558,8 | 1,78 % |
| SEPS – MAVIR | 92 990,0 | 7 677 340,7 | 1,21 % |
| MAVIR – SEPS | 75 590,0 | 1 125 399,3 | 6,72 % |
| SEPS – PSE | 86,0 | 10 941,0 | 0,79 % |
| PSE – SEPS | 2 013,0 | 136 142,0 | 1,48 % |
Total cross-border transmission agreed in Intraday process in 2016
on individual profiles – January – December 2016
Graphs of total monthly cross-border transmissions agreed via Intraday in individual hours of a day are published here.
Percentage of cross-border transmissions agreed in Intraday process to total cross-border transmission – January – December 2015
| Profile | Cross-border transmission Intraday (MWh) |
Total cross-border transmission (MWh) |
Percentage |
| SEPS – ČEPS | 196 835,0 | 1 848 922,4 | 10,65 % |
| ČEPS – SEPS | 141 627,0 | 12 097 744,7 | 1,17 % |
| SEPS – MAVIR | 26 877,0 | 7 861 095,2 | 0,34 % |
| MAVIR – SEPS | 41 812,0 | 319 431,3 | 13,09 % |
| SEPS – PSE | 58,0 | 3 392,0 | 1,71 % |
| PSE – SEPS | 2 176,0 | 402 053,0 | 0,54 % |
Total cross-border transmission agreed in Intraday process in 2015
on individual profiles – January – December 2015
Graphs of total monthly cross-border transmissions agreed via Intraday in individual hours of a day are published here.
Percentage of cross-border transmissions agreed in Intraday process to total cross-border transmission in 2014
| Profile | Cross-border transmission Intraday (MWh) |
Total cross-border transmission (MWh) |
Percentage |
| SEPS – ČEPS | 153 367,0 | 2 222 536,0 | 6,90 % |
| ČEPS – SEPS | 121 695,0 | 10 624 351,0 | 1,15 % |
| SEPS – MAVIR | 27 498,0 | 7 634 596,2 | 0,36 % |
| MAVIR – SEPS | 28 267,0 | 519 168,4 | 5,44 % |
| SEPS – PSE | 285,0 | 8 637,0 | 3,30 % |
| PSE – SEPS | 1 917,0 | 232 938,0 | 0,82 % |
Total cross-border transmission agreed in Intraday process in 2014 on individual profiles
Graphs of total monthly cross-border transmissions agreed via Intraday in individual hours of a day are published here.
Percentage of cross-border transmissions agreed in Intraday process to total cross-border transmission in 2013
| Profile | Cross-border transmission Intraday (MWh) |
Total cross-border transmission (MWh) |
Percentage |
| SEPS – ČEPS | 139 763,0 | 3 827 231,7 | 3,65 % |
| ČEPS – SEPS | 130 649,0 | 8 944 972,2 | 1,46 % |
| SEPS – MAVIR | 71 770,0 | 7 212 215,8 | 1,00 % |
| MAVIR – SEPS | 22 396,0 | 849 463,1 | 2,64 % |
| SEPS – PSE | 995,0 | 41 203,0 | 2,41 % |
| PSE – SEPS | 6 049,0 | 1 455 483,0 | 0,42 % |
Total cross-border transmission agreed in Intraday process in 2013 on individual profiles
Graphs of total monthly cross-border transmissions agreed via Intraday in individual hours of a day are published here.
Percentage of cross-border transmissions agreed in Intraday process to total cross-border transmission in 2012
| Profile | Cross-border transmission Intraday (MWh) |
Total cross-border transmission (MWh) |
Percentage |
| SEPS – ČEPS | 100 544,0 | 2 184 594,4 | 4,60 % |
| ČEPS – SEPS | 105 903,0 | 10 316 783,3 | 1,03 % |
| SEPS – MAVIR | 28 739,0 | 8 980 779,3 | 0,32 % |
| MAVIR – SEPS | 11 110,0 | 564 280,3 | 1,97 % |
| SEPS – PSE | 90,0 | 21 144,0 | 0,43 % |
| PSE – SEPS | 907,0 | 1 216 496,0 | 0,07 % |
Total cross-border transmission agreed in Intraday process in 2012 on individual profiles
Graphs of total monthly cross-border transmissions agreed via Intraday in individual hours of a day are published here.
Percentage of cross-border transmissions agreed in Intraday process to total cross-border transmission in 2011
| Profile | Cross-border transmission Intraday (MWh) |
Total cross-border transmission (MWh) |
Percentage |
| SEPS – ČEPS | 65 600,0 | 4 492 304,2 | 1,46 % |
| ČEPS – SEPS | 88 223,0 | 10 913 109,7 | 0,81 % |
| SEPS – MAVIR | 25 550,0 | 8 831 684,0 | 0,29 % |
| MAVIR – SEPS | 7 419,0 | 1 031 635,0 | 0,72 % |
| SEPS – PSE | 61,0 | 37 164,0 | 0,16 % |
| PSE – SEPS | 1 537,0 | 1 284 553,0 | 0,12 % |
Total cross-border transmission agreed in Intraday process in 2011 on individual profiles
Graphs of total monthly cross-border transmissions agreed via Intraday in individual hours of a day are published here.